HELENA — The U.S. Census Bureau already announced that Montana’s growing population has earned the state a second seat in the U.S. House of Representatives. Now the agency has released much more detailed information from the 2020 Census, giving us a better picture of how the population has shifted within Montana.
On Thursday, the Census Bureau released its “redistricting data,” updated numbers showing population, race and ethnicity and other statistics down to the county, city and even block level. The information allows states to draw Congressional and state legislative districts with relatively equal populations and ensure that all groups have fair representation.
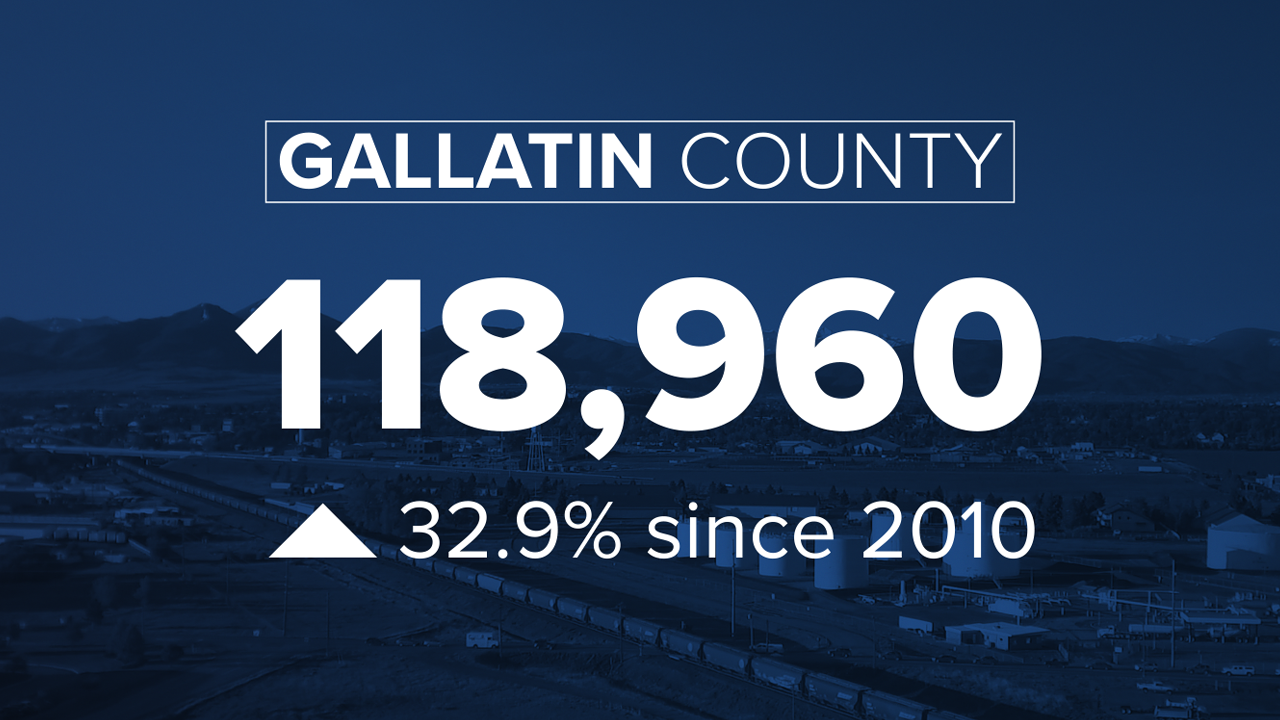
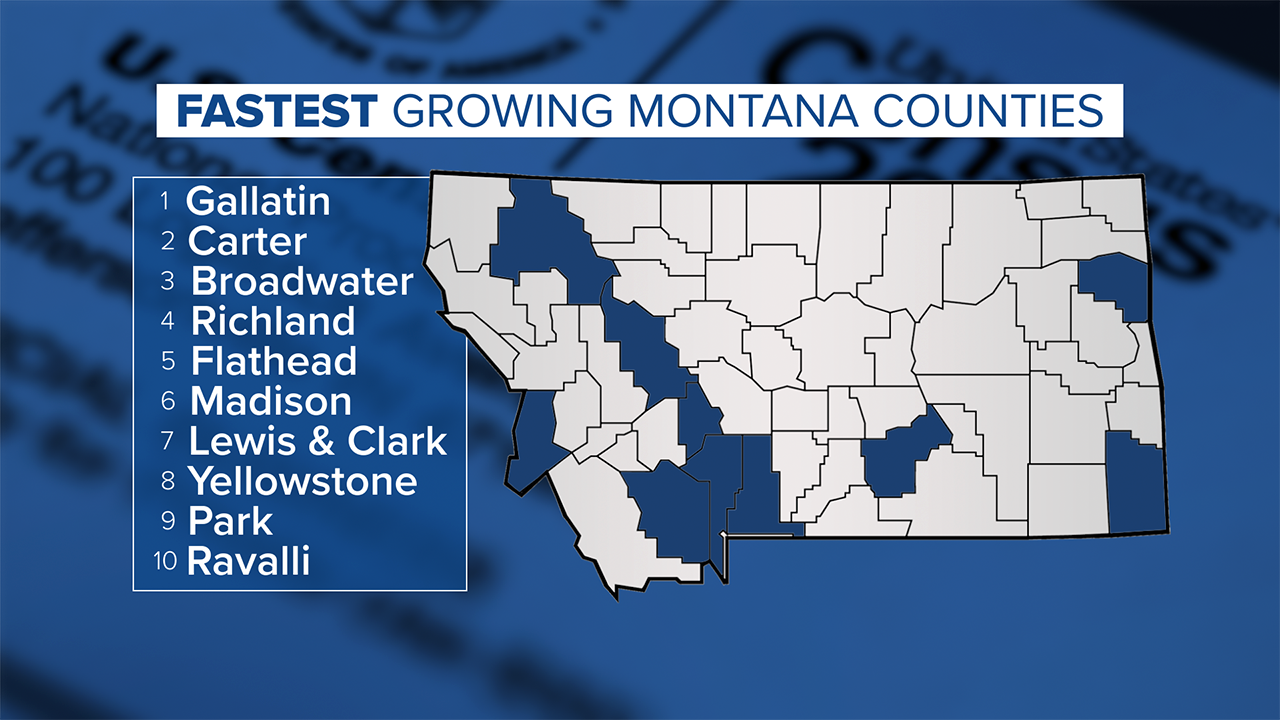
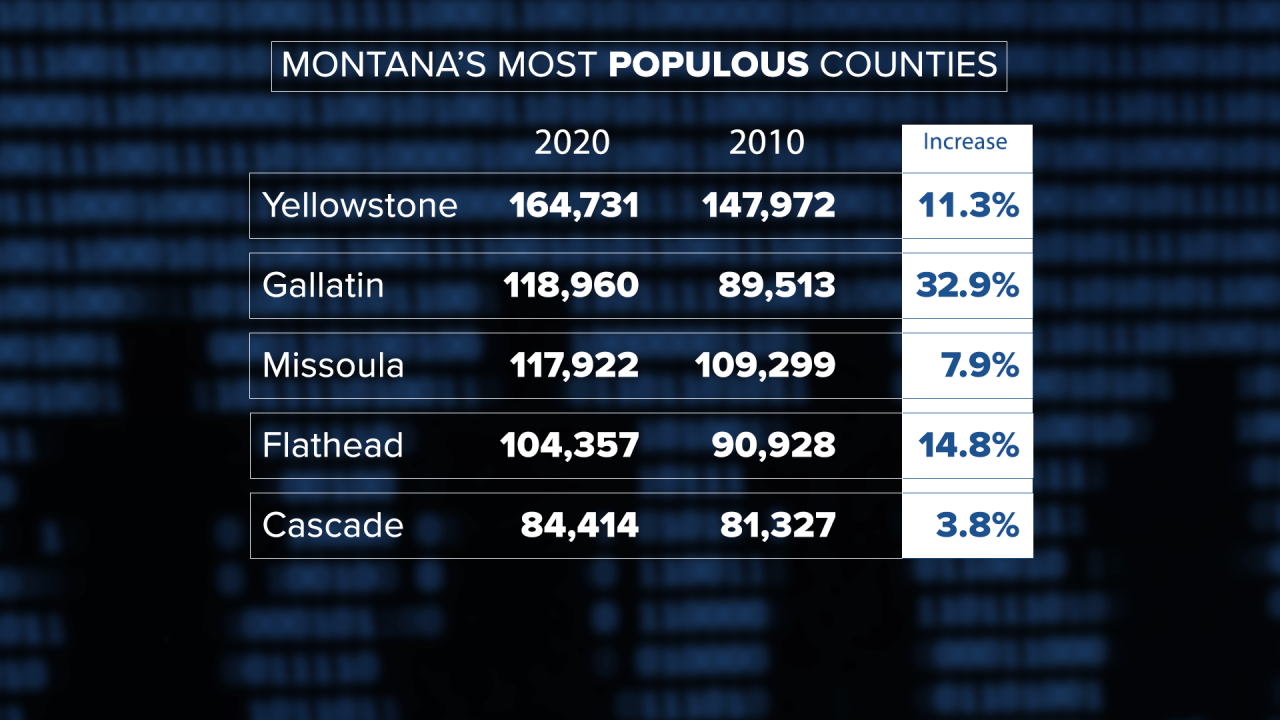
Once again, Montana’s fastest growing county is Gallatin County. Its population was 118,960 at the 2020 Census, up from 89,513 in 2010 – an increase of nearly a third. Gallatin County narrowly surpassed Missoula County’s 117,922 to become the second-largest population in the state.
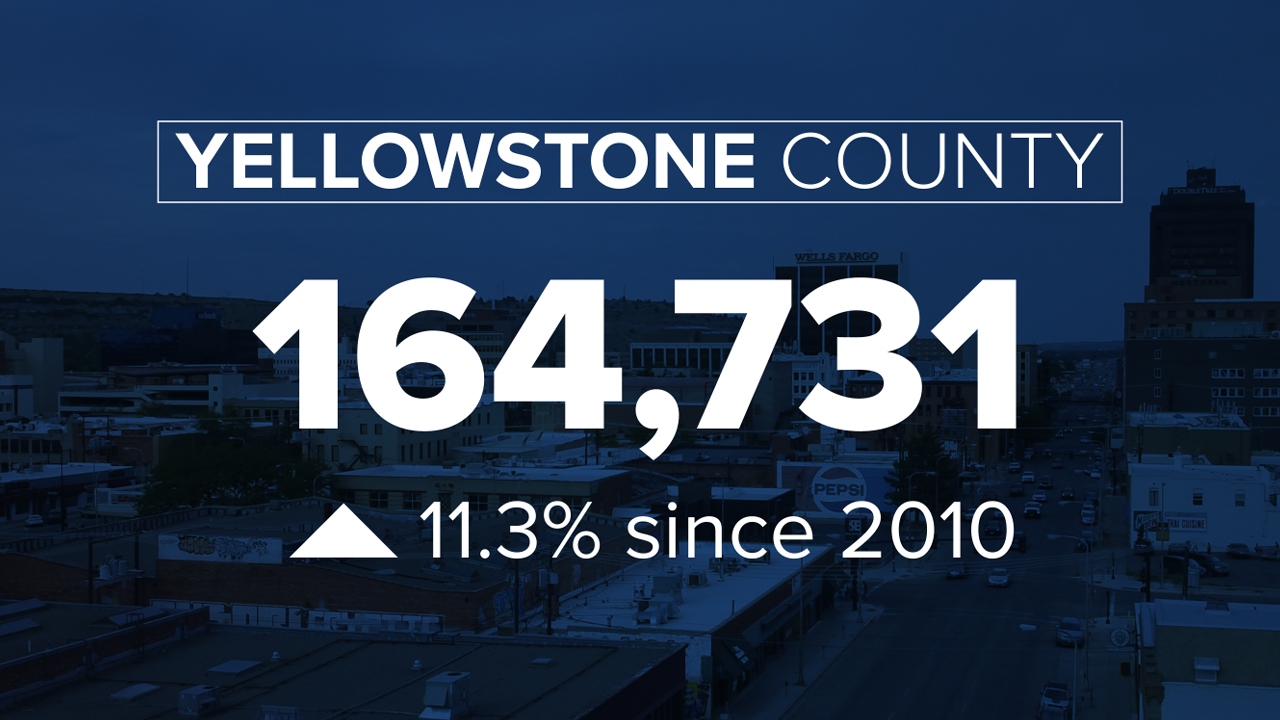
The largest county in the state remains Yellowstone County. It grew by 11.3%, adding 16,759 residents from 2010 to 2020.
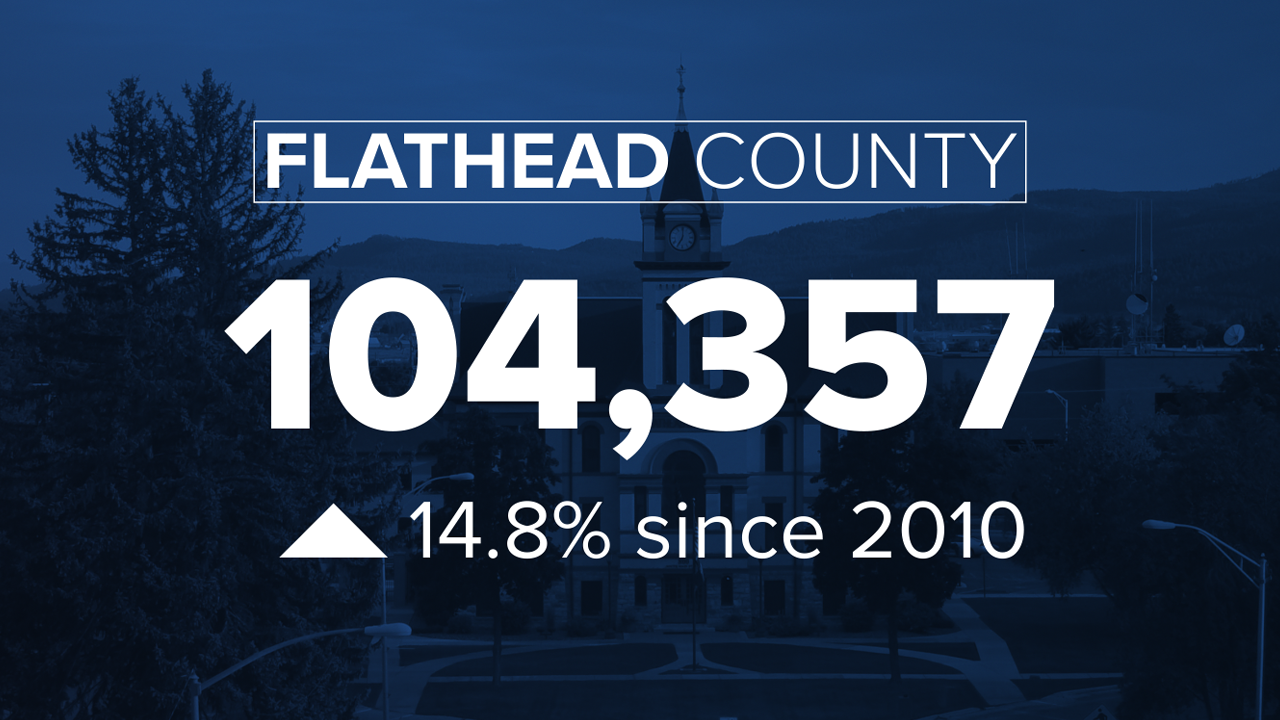
Flathead County added the third-largest number of new residents, growing to 104,357 in 2020. While its actual population number grew less than Yellowstone County’s, it was a larger percentage increase.
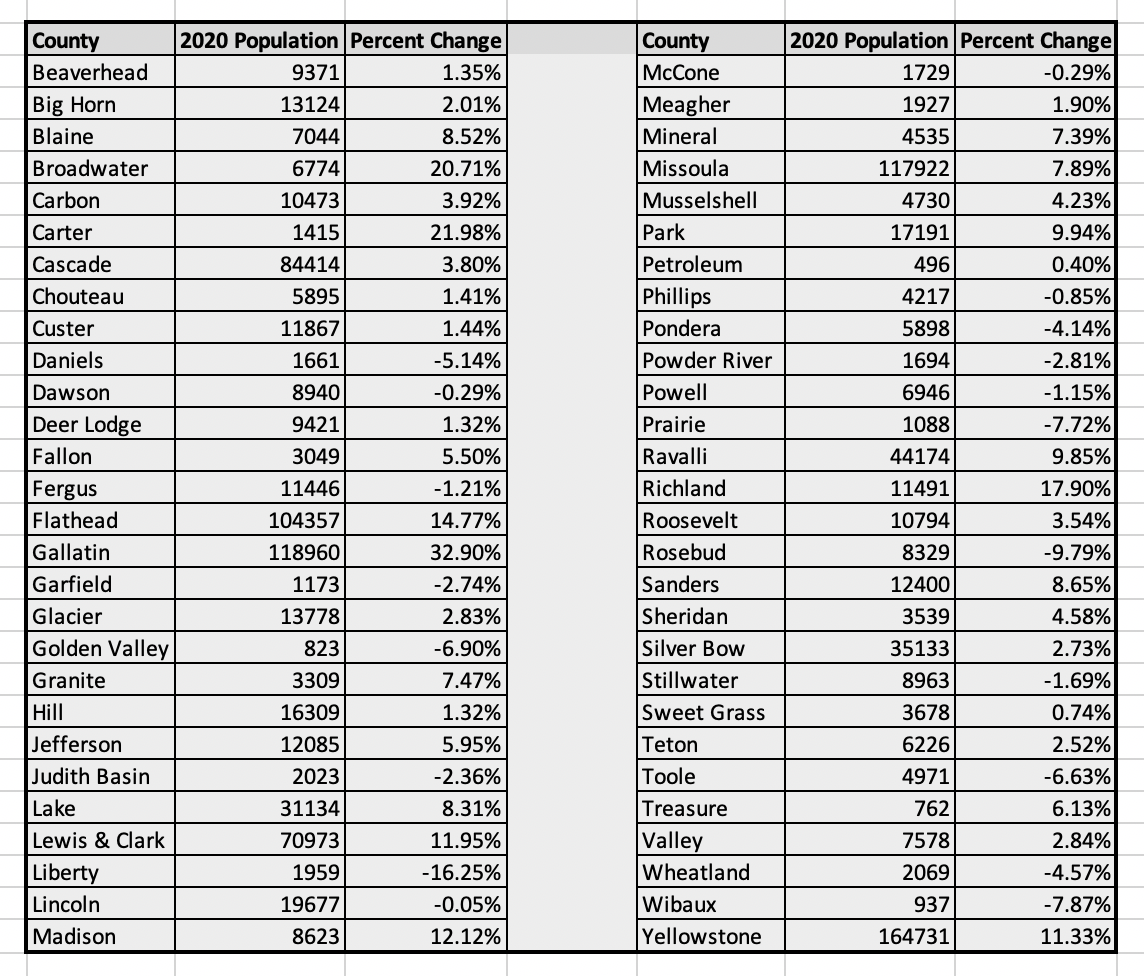
After Gallatin, the fastest-growing county in Montana was Carter County, in the state’s southeastern corner. Its population increased nearly 22%, from 1,160 in 2010 to 1,415 in 2020.
Ten counties grew faster than 9.7% – Montana’s statewide increase. In addition to Gallatin and Carter, they were Broadwater, Richland, Flathead, Madison, Lewis & Clark, Yellowstone, Park, and Ravalli.
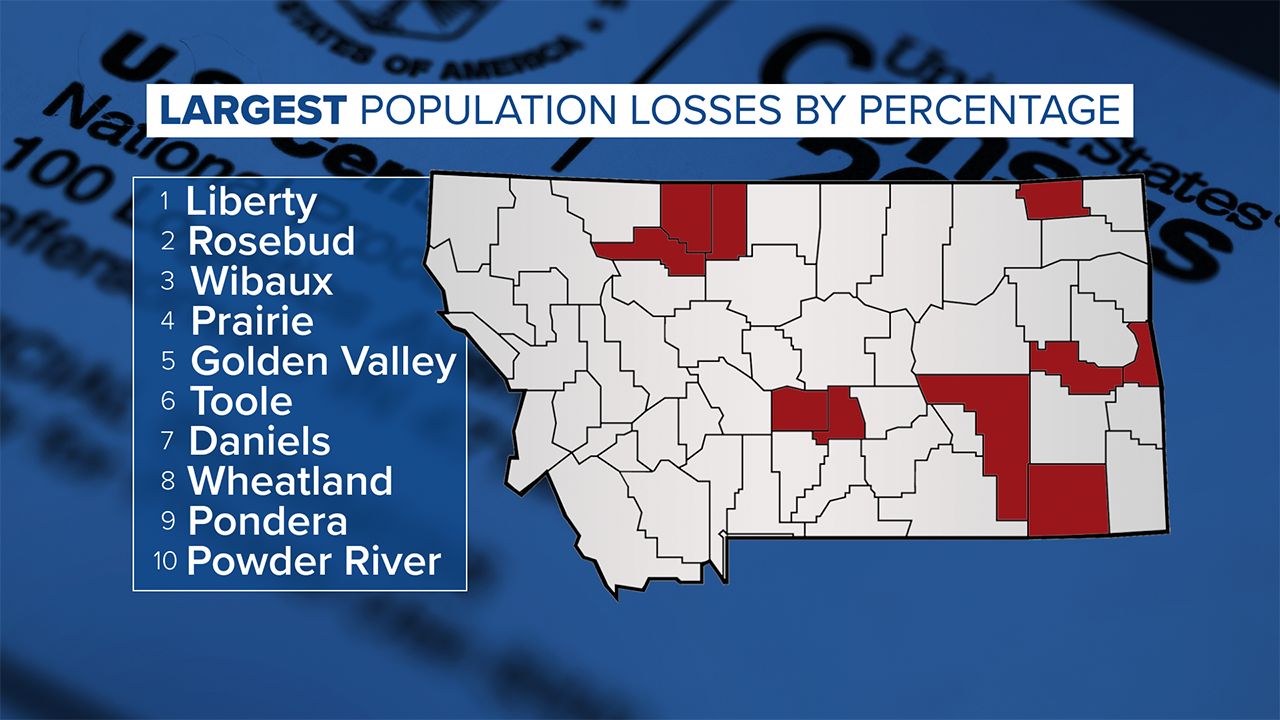
Nineteen counties, mostly in rural areas, saw their populations decrease at least slightly from 2010 to 2020. The largest reported population loss was in Liberty County, in north-central Montana. The 2020 Census showed its population was 1,959, down 16% from 2,339 in 2010 – though, notably, that 2020 figure was significantly lower than the Census Bureau’s estimated population last year.
Rosebud County reportedly lost the largest number of residents, with 904 fewer people in 2020 than 2010. Other counties with reported population decreases were Wibaux, Prairie, Golden Valley, Toole, Daniels, Wheatland, Pondera, Powder River, Garfield, Judith Basin, Stillwater, Fergus, Powell, Phillips, Dawson, McCone, and Lincoln. In the last two of those counties, the numbers showed only 5 and 10 fewer residents, respectively, than in 2010.
Julia Haggerty, an associate professor of geography at Montana State University, said the statistics weren’t surprising, but they were striking.
“To see the numbers really brings home how intense some of the growth trends and pressures are in some of our urban areas, and then similarly what some of the struggles might be in places that aren’t attracting new population and new jobs,” she said.
Haggerty said there are growing numbers of people whose work doesn’t tie them to a single location and employers who are trying to attract workers by locating in areas with high quality of life. She said those trends have brought growth in western cities like Bozeman.
“I would guess it’s probably even more accelerated once our COVID numbers really catch up,” she said.
That growth also comes with challenges. Haggerty said Gallatin County is already looking at the possibility of reaching limits on available water supply in the coming years.
Haggerty said it’s clear the modern economy has led to more job growth in cities than in many rural areas – except when they experience a specific boom like in Richland County’s oil industry. That could help explain why some smaller counties saw slower growth this decade.
However, Haggerty said she hoped people wouldn’t focus only on a narrative of “rural decline.”
“There are indications in some small towns in Montana of real vitality, and that is in places that may not be seeing significant population growth but are nonetheless rallying to be really vibrant places,” she said. “There’s a lot of, I think, hope still in those areas.”
Of course, one of the main uses for this data will be for the Montana Districting and Apportionment Commission. Once they officially receive the information, they will have 90 days to use it to draw the state’s new congressional districts for next year’s elections. The commission will discuss the data and their timeline for moving forward at a meeting Tuesday, Aug. 17.
The data will also determine the share of federal funding that cities and counties receive. The Montana Department of Commerce reports the state receives more than $2 billion in federal funding each year, and it is distributed based on population. That funding pays for things like highways and other infrastructure, health care, and education.
While the census data can now be broken down to extremely detailed levels, the Census Bureau cautions those smaller numbers may not always be exactly accurate. They have added “statistical noise” – adjusting the numbers to ensure individuals can’t be identified from the census responses. The agency says the impact should be minimal on numbers at a larger scale – like the total population of a county. However, there may be more change in smaller numbers, including smaller geographic areas and racial and ethnic or age breakdowns.
You can find more information about the new data on the Census Bureau website. The Montana Department of Commerce will also highlight key information on its Census and Economic Information Center website.